3. Assessing and measuring
Assessing and measuring needs is a core principle in eco-design. Before considering a redesign of your website or digital service it is crucial to understand the impact of the user journey and identify the main sources of improvement to pursue.
- If it is a new service, it could prove worthwhile to analyze a competing or similar service to avoid the same mistakes. Explore and measure the user experience on equivalent websites. Try to assess your projected number of users, the required hardware, and the impact of your service to the best of your ability in order to inform the choices you will make down the line.
- If you are building upon an existing product, gauge the environmental impact of the user journey and identify the areas of improvement to pursue and best practices to implement.
Questions to be answered
- What would constitute an "overuse" of the service? Can I gauge what the upper limit would be?
- What would qualify as going against the intended purpose of the service?
- What are the risks of rebound effect from the service being used?
- If I was working for the environment, what would I change about the design of the service?
- What nefarious consequences could result from large-scale use of my service?
The questions above come from the Tarot Cards of Tech.
For an existing service:
- What is the environmental impact of the user journey?
- What are the areas of improvement to pursue?
For a new service:
- What are the negative impacts in the short and long term?
- Do the benefits of the product outweigh those negative impacts?
Measuring those impacts also makes it more compelling when raising awareness, especially for decision makers who may be most receptive to metrics and quantitative targets. However, this process can be complex and time-consuming. Note: it is worth remembering that measuring is not an end in itself. The digital sector, like any other, must decrease its impact worldwide, and any improvement in that regard is worthwhile as long as it does not lead to a pollution transfer from one area of the lifecycle to another.
Assessing the impact of the user journey
After defining the functional unit (for instance "buying a train ticket online") and the scenario of use, assess the environmental footprint of the user journey.
You can use a tool like GreenIT Analysis, available on Chrome and Firefox as well as in command line interface (CLI) format, if you want to automate the analysis. This tool facilitates the assessment of:
- the environmental performance of the functional unit and its accompanying environmental impact (alternative: EcoIndex.fr),
- the implementation (or not) of best practices from the repository for digital eco-design (French) according to the testing guidelines and thresholds for compliance.
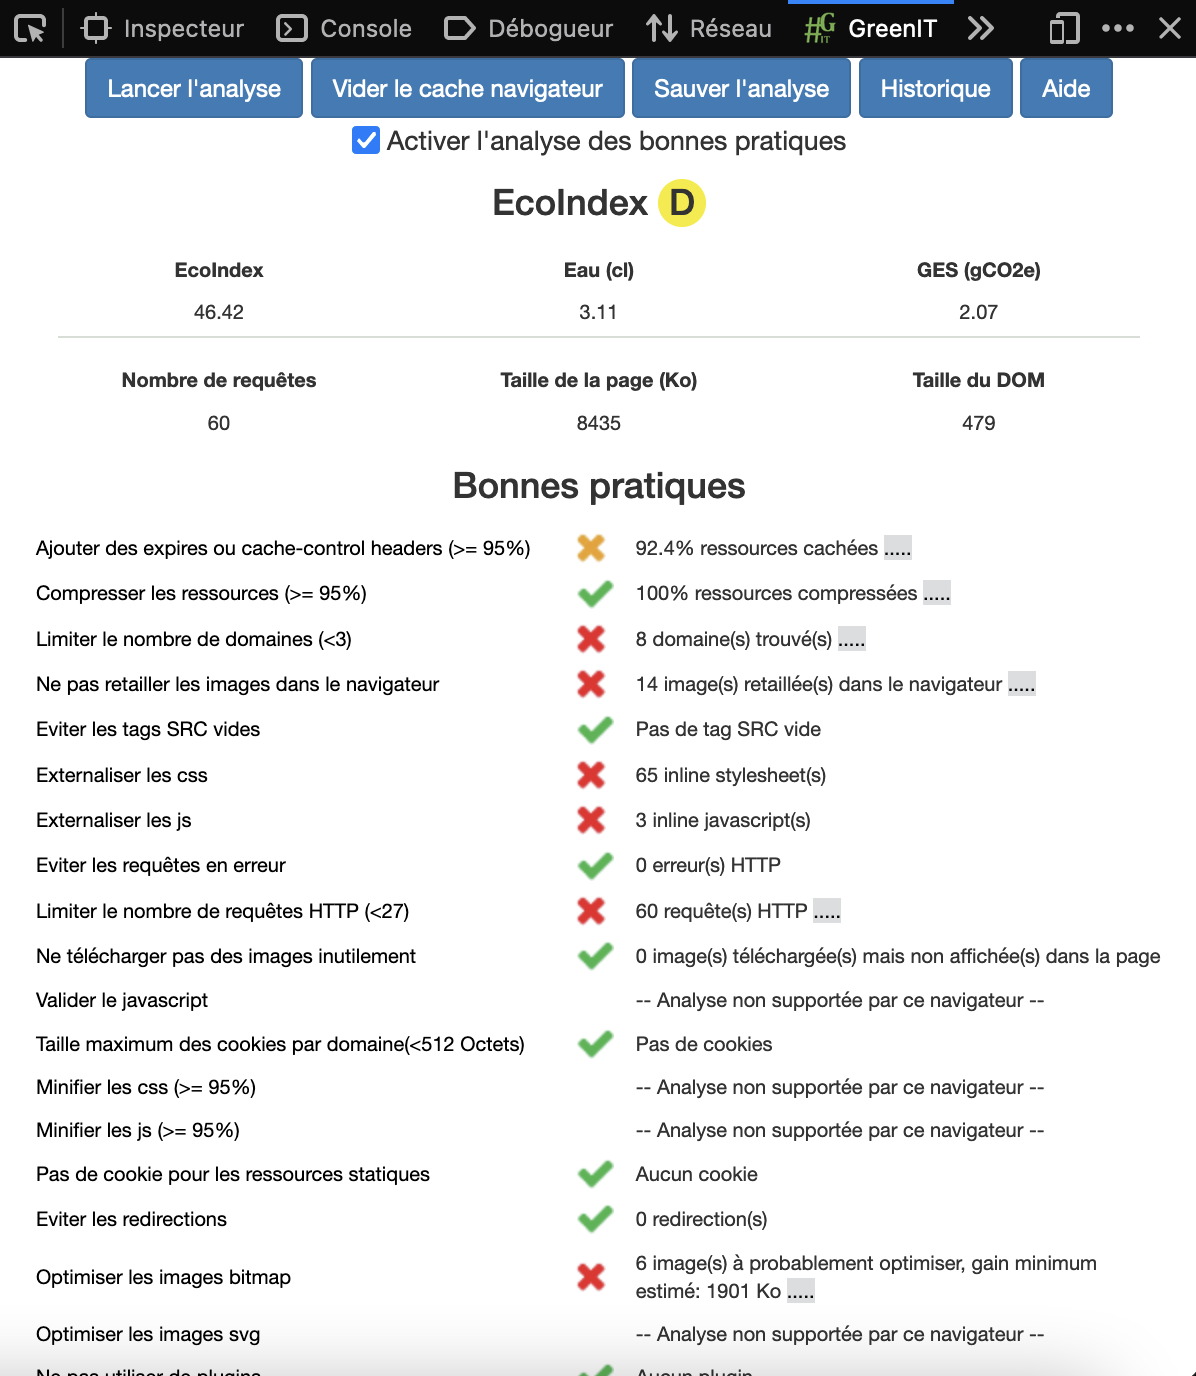
By using the "Activate best practices analysis" option on the GreenIT Analysis tool you will obtain a score and a list of ways to improve it.
The EcoIndex rating of each page is available on a scale from A to G (A being the best) and is accompanied by a score between 1 and 100 (100 being the best).
The EcoIndex metrics (weight of the page, number of queries, number of elements on the DOM), as well as the best practices tested for the given page, will give you some leads to pursue in order to improve the rating.
Note: Make sure to clear the cache before starting the analysis and to deactivate your adblocker(s) for a more realistic rating. Also, the analysis should be launched only after scrolling and carrying out some actions on the page.
Using the GreenIT-Analysis plugin
In this example a D rating is the result of the assessment of the environmental impact of a webpage using the GreenIT Analysis plugin. This is because the page weighs over 8 MB and because a number of eco-design best practices have not yet been applied.
After running the analysis and saving each page, the entire browsing history is available in the "History" section. You can then export the results to a sheet and add up the total impact of the user journey.
Depending on scenarios of use, it may be relevant to assess the impact of an "exploratory approach" as well as a "recurring approach":
- Exploratory approach: Clear the cache of your web browser. Assess the impact of the user journey based on the chosen functional unit. Do not forget to save the analysis of each page that was browsed.
- Recurring approach: Assess the impact of the user journey for following visits without clearing the cache (the data should be cached and the impact lessened).
This assessing and inventorying step can also be an opportunity to gauge other metrics to do with performance using standard tools such as GTmetrix, Lighthouse, Yellow Lab Tools, etc. A website following the principles of eco-design will not only be light but also have higher performance results since it is more efficient.
The Network tab of your browser also provides a lot of information in order to understand what is happening as the page loads. You can consult the number of queries made and the size of all data loaded. A single HTTP query can be worth dozens of MB of data.
Note: Whether you choose GreenIT Analysis or another tool, it is important to use the same one throughout the entire optimization process so that the results are comparable.
Important distinction: assessing the environmental impact with these tools does not replace an audit and a Life-cycle Assessment (LCA) conducted by experts. The LCA method is based on ISO 14040 et 14044 standards (Life-cycle Assessment (French)). It is the only recognized tool included in the gradual roll out of environmental labelling in France and Europe.
For further information:
- Livre blanc - Eco-design of digital services, Alliance GreenIT, 2017 (French)
- What is EcoIndex?, EcoIndex
- Under the hood of the EcoIndex rating, Blog Octo (French)
- GreenIT Analysis - readme (French)
- Toolbox - Collective for the sustainable design of digital services (French)
Identifying where to cut excess weight
When it comes to redesigning an existing website, it is sometimes possible to obtain browsing data from the site, for instance if the client used a service such as Google Analytics or ContentSquare, or an open source solution such as Matomo or plausible.io. The latter two are superior in terms of confidentiality of user data (Google Analytics : about the formal notice from the CNIL (French)).
Doing so might point you towards multiple opportunities to implement principles of eco-design:
- Pages on which the users stay a very short or very long amount of time compared to their content: Is the user encountering a problem? → Opportunity to improve the flow of the journey.
- Repeated back-and-forth between two pages: Is there something unclear for the user? → Opportunity to simplify and shorten the overall journey.
- Pages with a high bounce rate: What do users expect from this page? Are there too many links leading to this page? → Opportunity to rebuild the page with an eco-design approach, to delete the page, or to exclude it from the user journey wherever it is not necessary.
- Pages or user journeys that garner the most visits: What is the environmental impact of these user journeys? Do these pages use a lot of resources? Can I reduce their impact, even marginally? → Opportunity to reduce the impact of many users' journey.
- Most frequently searched keywords: What are the users looking for? Can I help them find it more easily by restructuring the menu or the homepage for example? → Opportunity to streamline the user journey and limit the number of queries.
- Regions of the world where most of my users are: What countries are they based in? → Opportunity to bring my web hosting services closer to my users to reduce the environmental impact.
- Pages that are never visited: Is it possible to remove them? Is their content obsolete? → Opportunity to reduce the size of the website.
Gathering this information is useful before undertaking significant changes as it makes it easier to compare the performance before and after redesign. It is worth remembering that gathering data draws energy. If a website is not undergoing much change, it might not be useful to record these metrics on a daily basis.
Questions to be answered
- What data do I need?
- How often do I need it?
- Over what period of time?
- Which is the ideal solution to gather the data? Which is the lightest and most respectful of user privacy?
- Have I accounted for the expiry and deletion of the data?
RGSEN Criterion 1.6
Collecting data in a manner that is "ethical and well-thought-out" would fulfill the recommendations of Criterion 1.6 of the General Repository for the Eco-design of Digital Services (Référentiel Général de l'Ecoconception des Services Numériques - RGESN).
See the repository (French)
Environmental budgeting
Instead of designing the page and then measuring its impact, we can take the opposite approach: what is the maximum size my page can be for it to be loaded up quickly no matter the conditions (network, device)? Much like the financial or time constraints a digital service has to abide by during development, it could be subjected to environmental constraints.
In the case of a website for train schedules for instance, users might want to use this service from a train shortly before it arrives at a station, with limited network connectivity and from a smartphone. In those conditions, assuming the website must load up in under three seconds to avoid an excessively high bounce rate, how much can the page weigh? Performance Budget Calculator is an online tool that allows you to quickly calculate this.
Likewise, what is the maximum time the user is willing to spend to execute their task (functional unit)? By establishing a constraint in terms of duration we can reduce not only the time spent on the device, but also save battery life and reduce the amount of attention the user has to expend.
Questions to be answered
- What is the maximum acceptable loading time for the users?
- What is the maximum duration for the user journey to accomplish the task at hand (functional unit)?
- What bounce rate from excessively long loading times can I accept?
- What is the connectivity situation of most users when they access my digital service?
- What situation of degraded connectivity might my users find themselves in while trying to access my digital service?
- What new target audience could I reach if my digital service were accessible in a situation of degraded connectivity?
- Who am I currently excluding from using my digital service if it requires the transfer of X MB in data to be used adequately?
RGSEN Criterion 1.5
Though it does not fall under a designer responsibility, it should be noted that setting quantified targets in terms of limiting and reducing the environmental impact would fulfill the recommendations of Criterion 1.5 of the General Repository for the Eco-design of Digital Services (Référentiel Général de l'Ecoconception des Services Numériques - RGESN).
See the repository (French)
RGSEN Criterion 6.1
Sticking to a maximum size and number of queries per screen would fulfill the recommendations of Criterion 6.1 of the General Repository for the Eco-design of Digital Services (Référentiel Général de l'Ecoconception des Services Numériques - RGESN).
See the repository (French)
For further information:
- Situer le numérique, Gauthier Roussilhe (French)
- Product Environmental Footprint
- Has the design team set a page weight budget?, Sustainable Web Design