4. Evaluate and Measure
Evaluation
The evaluation stage enables a comparison to be made in order to identify the elements to be modified.
Unfortunately, there are currently few resources available to help designers, project managers and project owners/managers evaluate a digital service in terms of dark patterns.
These resources are even more important as they are objective and therefore avoid subjectivity.. Without a defined tool or method, there is a high risk of subjectivity in the assessment.
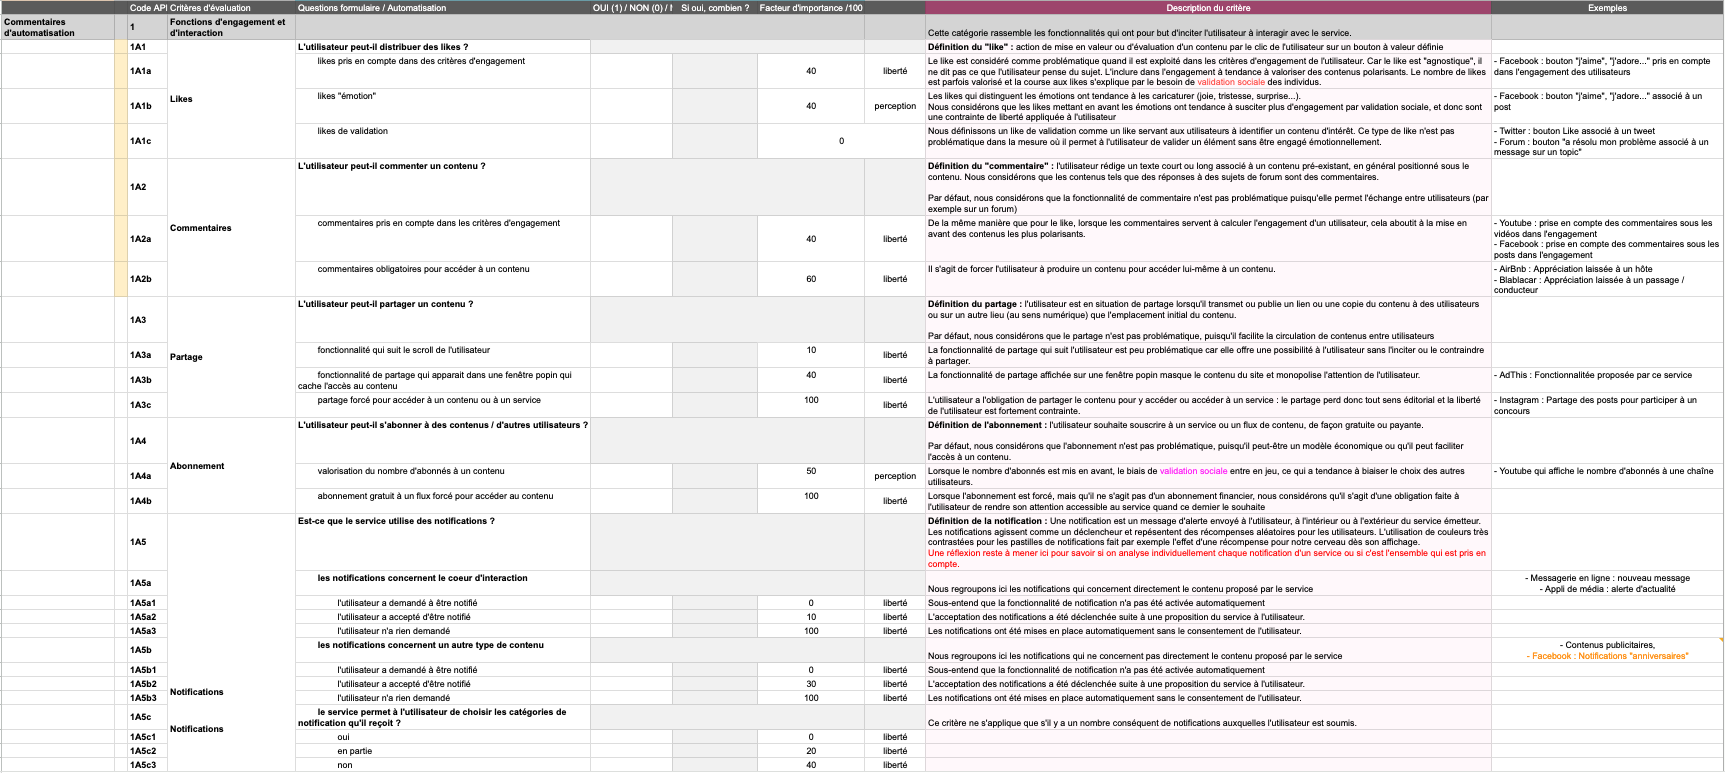
Here is an initial grid to give an initial view of the deceptive and persuasive elements of the service: Captology evaluation matrix by Karl Pineau and Aurelia Fabre.
Captology evaluation matrix
After a series of questions, we get a final score (from 0 to over 2,000). This mark is converted into a letter (from A to G), indicating the level of appeal and persuasiveness of the digital service.
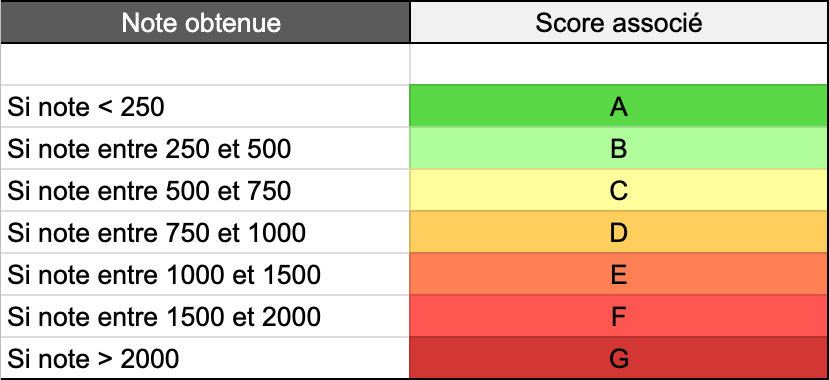
For each question, depending on our answer, we get more or less points. For each answer, a description of the criterion explains what the problem is. There are also examples to help us see where we stand.
Find out more:
Interactive persuasion criteria grid by Alexandra Nemery, Eric Brangier and Steve Kopp
- Research article on the grid (French)
- Nemery’s thesis (French)
Measure
Various indicators monitor and measure a project throughout its life cycle. These are known as KPIs (Key Indicator Performance). These are generally centred on the number of customers, turnover, time spent on the service, and so on.
We need to question these indicators and reinvent them, by focusing on the human experience. By aligning the indicators with the human element, it will be easier for the service to be respectful of the user.
Examples of indicators to take into account :
- user satisfaction (did they find what they were looking for easily)
- the amount of time spent on the service (simple, fluid user path)